Gold (XAU/USD) settled the past week at two-week highs of $1930.60, having recorded the second straight weekly gain. The yellow metal tracked the rally in stocks amid a broad US dollar sell-off, induced by the increased expectations of the US policymakers agreeing on a comprehensive fiscal stimulus deal.
Heading into a fresh week, gold traders will continue to closely follow the developments concerning the multi-trillion-dollar aid package alongside the US inflation, consumer spending data and Fedspeak for fresh direction on the prices.
From a technical perspective, let’s see how gold is positioned, especially in the wake of the bullish breakout.
Gold: Key resistances and supports
Gold gave a weekly closing above the critical $1928 level on Friday, opening doors for the further upside.
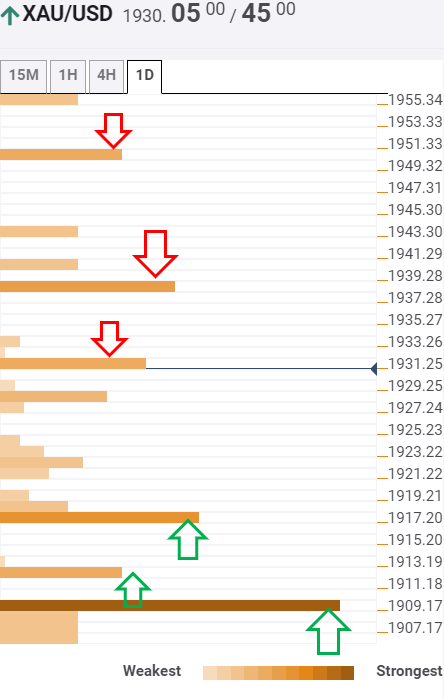
The Technical Confluences Indicator suggests that the XAU bulls need a break above the immediate hurdle at $1931, the previous day high, for the next leg higher.
Strong cap at $1938 will be next on the buyers’ radar. That level is the Fibonacci 61.8% one-month.
Further, the pivot point one-week R1 lies at $1950, which could be the level to beat for the bulls.
On the flip side, powerful support awaits at $1918, the confluence of the Fibonacci 38.2% one-day and Fibonacci 23.6% one-week.
The next soft cap is seen at $1912 (SMA100 15-minutes), below which the robust support at $1910 could be put at risk. At the latter, the Fibonacci 38.2% one-week and SMA10 four-hour coincide.
Here is how it looks on the tool

About Confluence Detector
The Confluence Detector finds exciting opportunities using Technical Confluences. The TC is a tool to locate and point out those price levels where there is a congestion of indicators, moving averages, Fibonacci levels, Pivot Points, etc. Knowing where these congestion points are located is very useful for the trader, and can be used as a basis for different strategies.
Learn more about Technical Confluence
