- Gold is off weekly tops but holds gains above $1930.
- Overbought conditions on the 4H chart warrant caution for the bulls.
- $1940 and $1950 still remain on the buyers’ radars.
Gold (XAU/USD) holds the higher ground near eight-day tops of $1935, as the bulls gather pace for the next push to the upside.
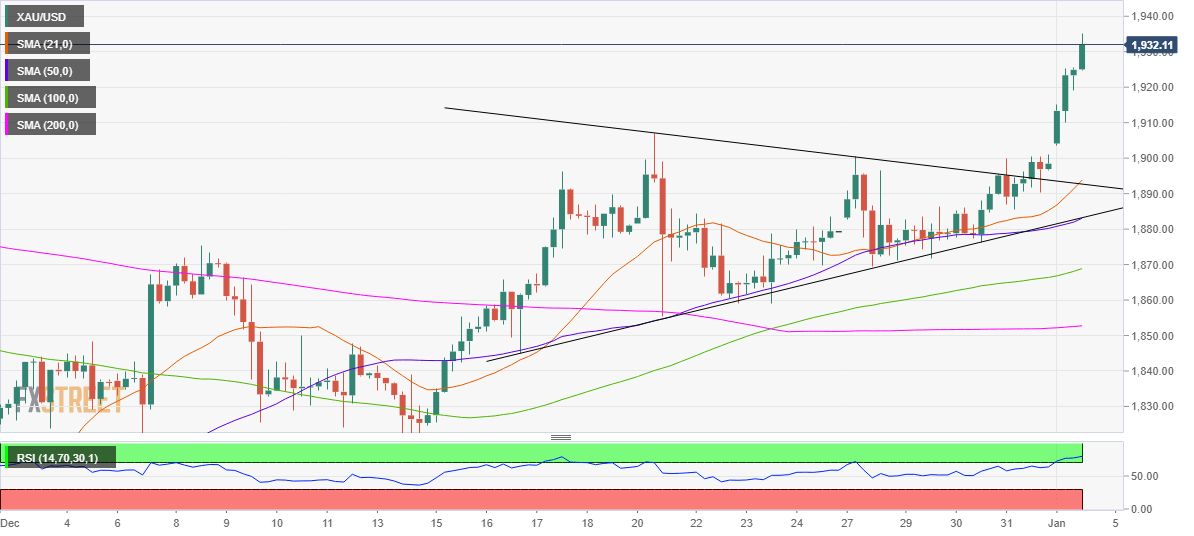
As observed in the four-hour chart, gold confirmed a symmetrical triangle breakout on the final trading day of the year 2020.
Gold Price Chart: Four-hour

The bulls built onto Thursday’s upside break, extending the upbeat momentum into the first trading day of 2021.
The precious metal has rallied as much as $20 so far, with room for additional upside despite the Relative Strength Index (RSI) trending in the overbought zone, at the momentum.
The measured pattern target is aligned at $1940, above which the $1950 psychological barrier could come into the picture.
Alternatively, the confluence of the 21-simple moving average (SMA) and pattern resistance at $1893 will act as strong support.
The next relevant downside barrier is seen at $1883, the intersection of the 50-SMA and pattern support.
