- USD/CAD prints mild gains but stays above short-term SMA.
- Bullish candlestick, MACD signals join sustained trading above 21-day SMA to favor buyers.
- Sellers will have a bumpy road above February low.
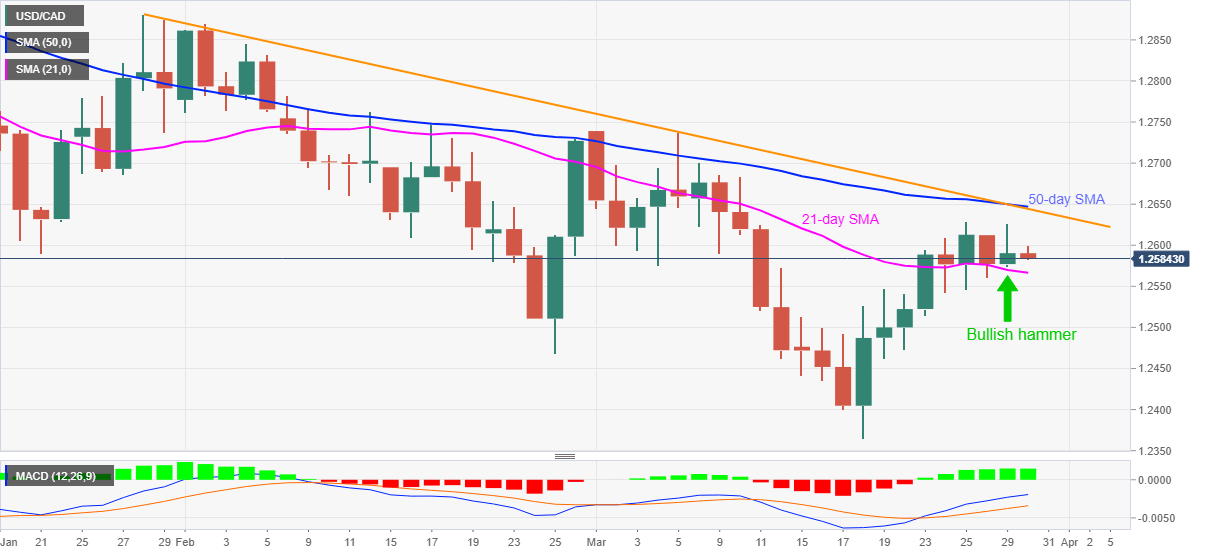
USD/CAD drops to an intraday low of 1.2583, down 0.05% on a day, during early Tuesday. In doing so, the quote fails to justify the previous day’s bullish candlestick formation on the daily chart.
However, successful trading above 21-day SMA and bullish MACD, coupled with Monday’s “inverted hammer”, favor USD/CAD buyers targeting 1.2645-50 resistance confluence that includes 50-day SMA and a descending trend line from January 28.
Meanwhile, 1.2630 can offer an intermediate halt whereas the monthly top around 1.2740 can entertain USD/CAD bulls beyond 1.2650.
On the contrary, a daily closing below the 21-day SMA level of 1.2566 will defy the bullish candlestick and can direct USD/CAD lower to mid-1.2500s and 1.2500 support levels.
However, USD/CAD bears are less likely to get convinced unless witnessing a clear downside below February’s low of 1.2468.
USD/CAD daily chart
Trend: Upside expected

