- AUD/USD bears need a break of support to confirm a downside bias.
- Bulls are in charge while testing deeper into the weekly resistance.
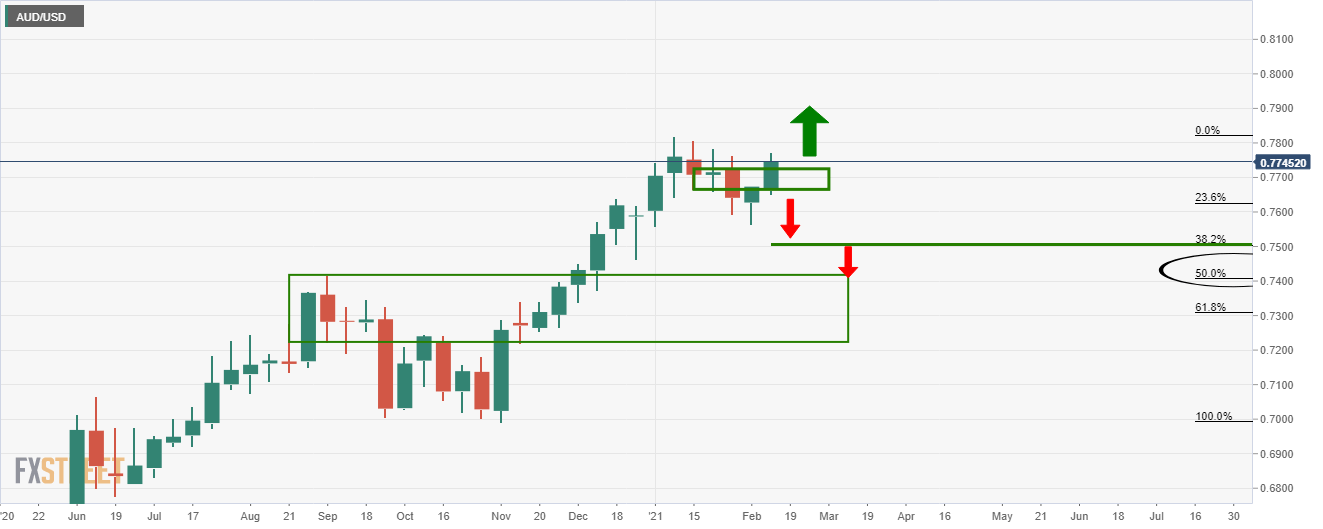
AUD/USD bulls are in charge on the long-term time frames, but a close below resistance will open prospects of a retracement of the daily bullish impulse.
The following is a topdown analysis that illustrates where the next opportunity could arise on the lower time frames.
Weekly chart, AUD/USD
There is an upside bias so long as the price remains above this newly formed support following the recent bullish weekly test of resistance.
A weekly close above the prior highs will negate downward trade setups.
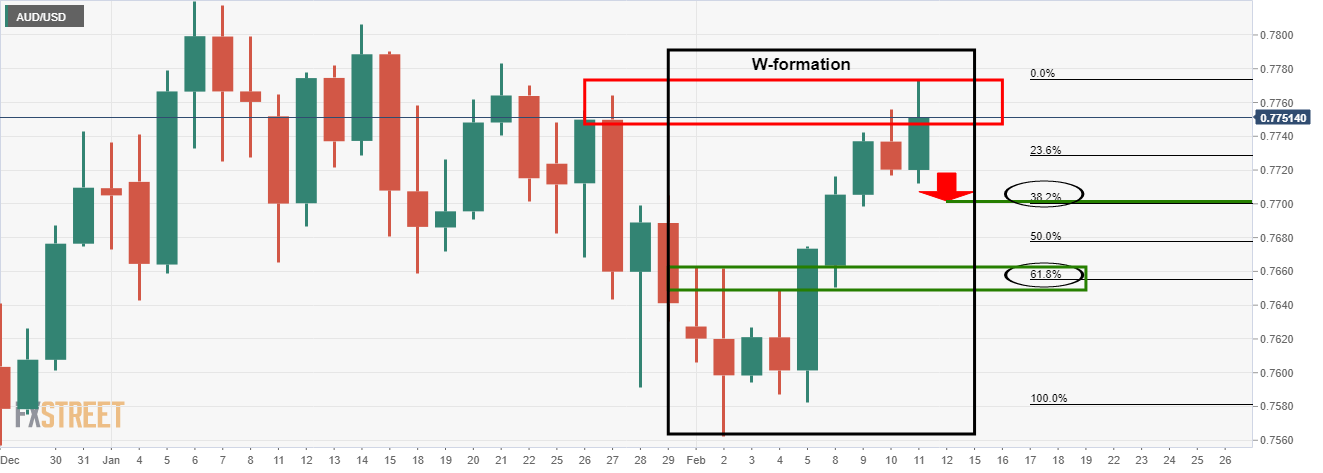
Daily chart, AUD/USD
With that being said, the daily chart is offering a different scenario.
The W-formation is a bearish chart pattern that would expect to see at least a 38.2% Fibonacci retracement of the bullish impulse.
A test of the 0.77 figure is, therefore, still o play for. However, a daily close above the prior day’s highs will be bullish.
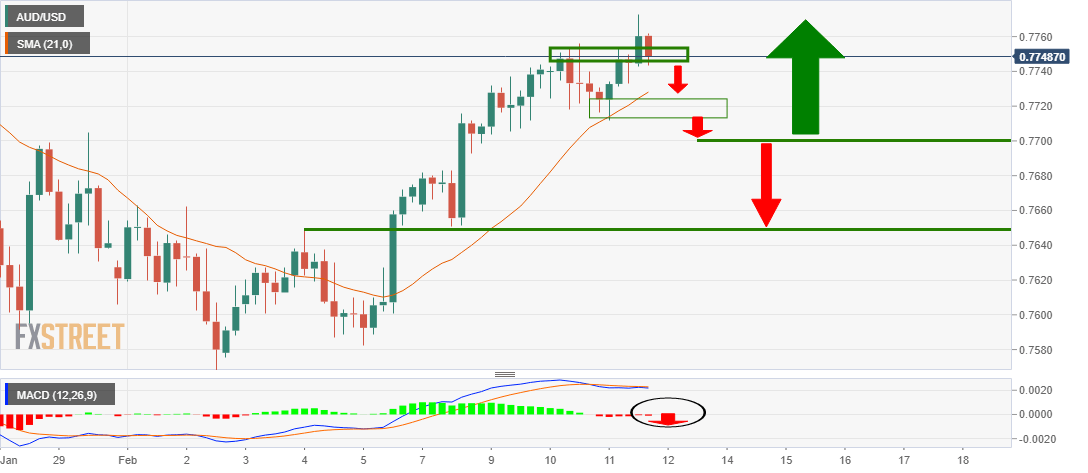
4-hour chart, AUD/USD
The conditions on the 4-hour chart are bullish.
There is little in the way of a high probability setup that can be taken by the bears in targeting 0.77 the figure until the bearish structure has been formed, or MACD is below the zero line and price below the 21 moving average.
Given the proximity of the 0.77 figure and price, there is little in the way of reward and a lower time frame would be more appropriate in this scenario.
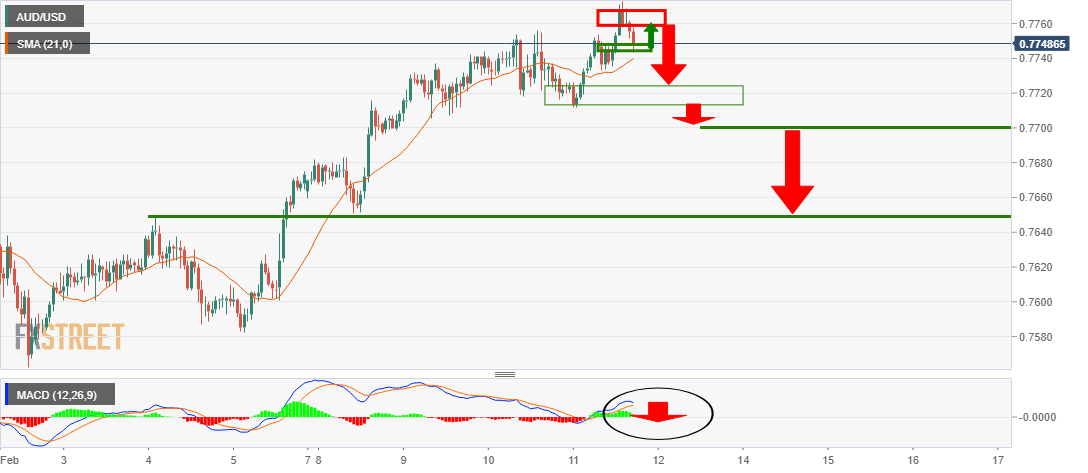
1-hour chart
The 1-hour chart offers prospects of a trade set up if the price breaks support and retests the structure from resistance.
A break below the lows will open risk towards the neckline of the daily M-formation and confluence of a 61.8% Fibonacci retracement of the daily impulse around 0.7650.


