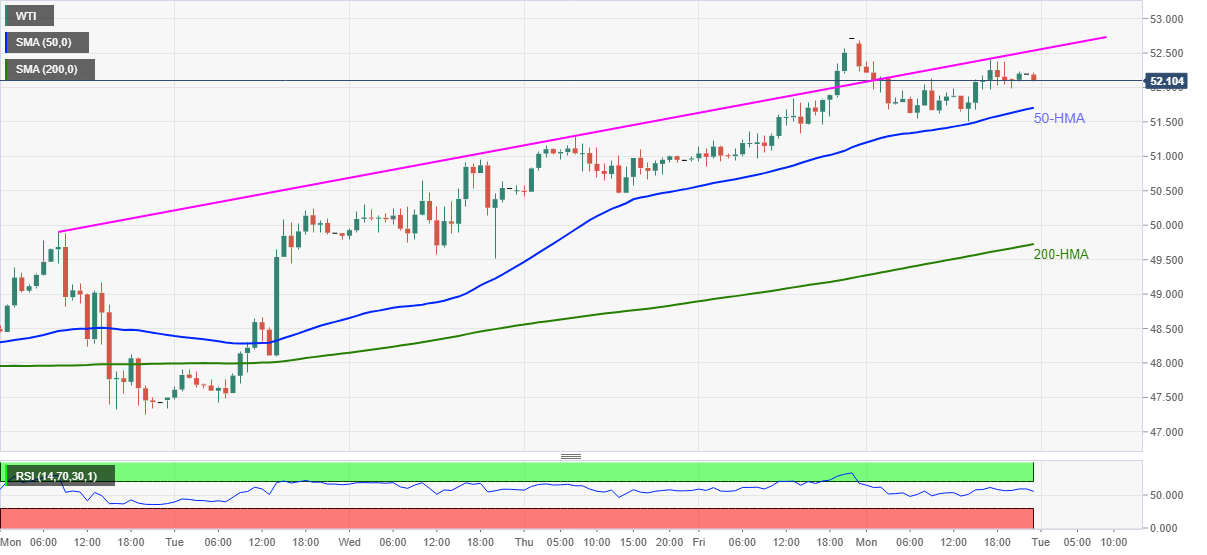
- WTI fades bounce off 50-HMA while staying near 11-month top.
- Strong SMA supports keep oil buyers hopeful despite RSI’s downside bias.
- One-week-old resistance line guards immediate upside, 200-HMA adds to the downside filters.
Although 50-HMA probed WTI pullback from February 2020 top, the oil benchmark eases to $52.12 during Tuesday’s Asian trading.
Considering the quote’s failures to extend the recovery moves beyond a short-term resistance line, coupled with receding RSI, WTI is likely to revisit 50-HMA support of $51.70.
However, any further weakness past-$51.70 will have to conquer the $50.00 psychological magnet, as well as the 200-HMA level of $49.70, to please the commodity bears.
Meanwhile, a one-week-old rising trend line, near $52.55, offers immediate resistance to the quote ahead of the recent high surrounding $52.70.
In a case where the energy bulls manage to refresh the multi-month top, February 2020 peak close to $54.70 should return to the charts.
Overall, the oil prices are in an uptrend while marking intermediate pullbacks off-late.
WTI hourly chart
Trend: Pullback expected

