Following Wednesday’s sell-off, Gold (XAU/USD) traded within the $1825-$1850 range in the balance of the week, settling almost unchanged below $1840. The choppy trading could be attributed to the coronavirus vaccine-driven optimism and US fiscal stimulus headlines.
Heading into a fresh, an elusive US stimulus aid package and the FDA Pfizer’s covid vaccine authorization alongside the US dollar’s comeback could check gold’s upside attempts. Meanwhile, dovish Fed expectations, weak US employment data and virus growth could keep a floor under the prices.
How is gold positioned on the charts?
Gold: Key resistances and supports
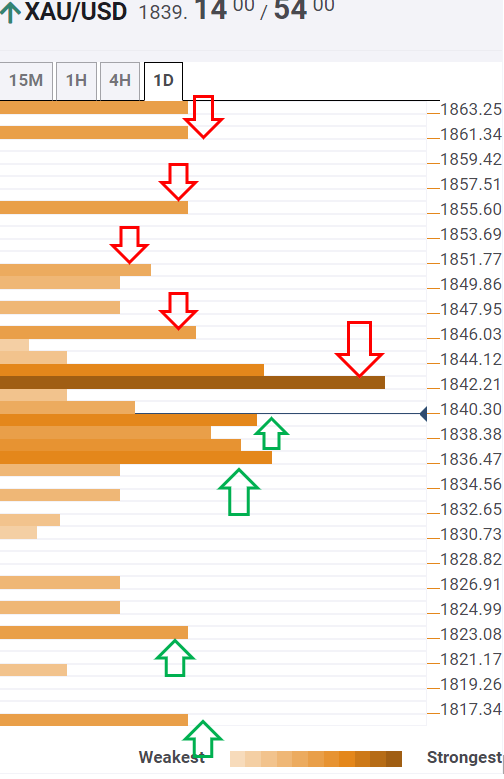
The Technical Confluences Indicator shows that gold’s failure to close the week above the critical $1842 resistance, the confluence of the Fibonacci 38.2% one-month and SMA50 four-hour, keeps the downside in play.
The intersection of the Fibonacci 38.2% one-day and Bollinger Band one-day Middle at $1840 is expected to offer immediate cushion.
A dense cluster of healthy support levels around $1837/$1835 could limit the further downside in gold. That area is the confluence of the SMA10 four-hour, previous low four-hour and SMA10 one-day.
The next relevant cushion awaits at $1824; the previous week low, below which floors could open up towards the Pivot Point one-week S1 at $1817.
Alternatively, acceptance above the aforementioned key $1842 barrier is critical to reviving the recovery momentum.
The buyers could then target a minor resistance line at $1846, which is the Bollinger Band 15-minutes Upper.
The convergence of the SMA100 one-hour and Pivot Point one-day R1 at $1850 is the level to beat for the bulls.
Further up, the Fibonacci 38.2% one-week at $1855 will come into the buyers’ radar, above which the next upside barrier is aligned at $1861 – the Pivot Point one-day R2 and SMA200 four-hour meeting point.
Here is how it looks on the tool

About Confluence Detector
The Confluence Detector finds exciting opportunities using Technical Confluences. The TC is a tool to locate and point out those price levels where there is a congestion of indicators, moving averages, Fibonacci levels, Pivot Points, etc. Knowing where these congestion points are located is very useful for the trader, and can be used as a basis for different strategies.
Learn more about Technical Confluence
