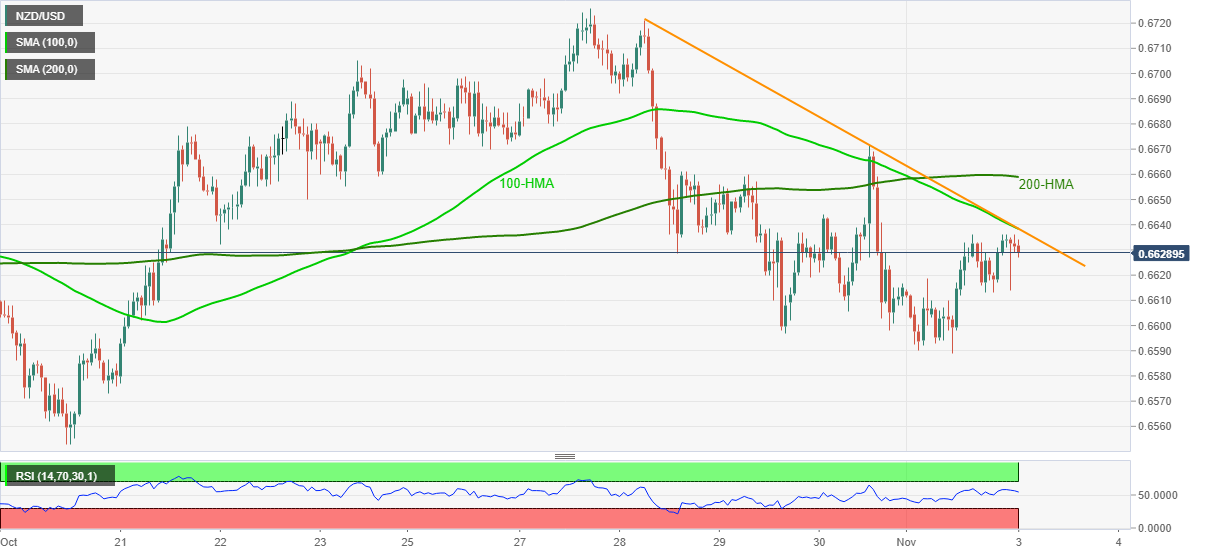
- NZD/USD fails to keep Monday’s recovery moves beyond 0.6635.
- Key SMAs, short-term falling trend line question buyers amid normal RSI conditions.
- Bears eye the previous day’s low during further weakness.
NZD/USD wavers around 0.6630 during Tuesday’s Asian trading. The kiwi pair snapped a three-day losing streak on Monday before portraying the pullback from 0.6636 in the last few hours.
In doing so, the quote softens ahead of the key upside hurdle comprising 100-HMA and downward sloping resistance line from October 28.
With the RSI neither around the oversold nor overbought area, NZD/USD prices can extend the latest weakness towards Monday’s low of 0.6589. Though, the 0.6600 round-figure becomes immediate support to watch.
On the flip side, a clear break of 0.6840 resistance joint will confront a 200-HMA level of 0.6660 and Friday’s top of 0.6670 during the extra rise.
In a case where the NZD/USD bulls dominate past-0.6670, the 0.6700 threshold will precede October’s high surrounding 0.6726 to grab the market attention.
NZD/USD hourly chart
Trend: Further weakness expected

